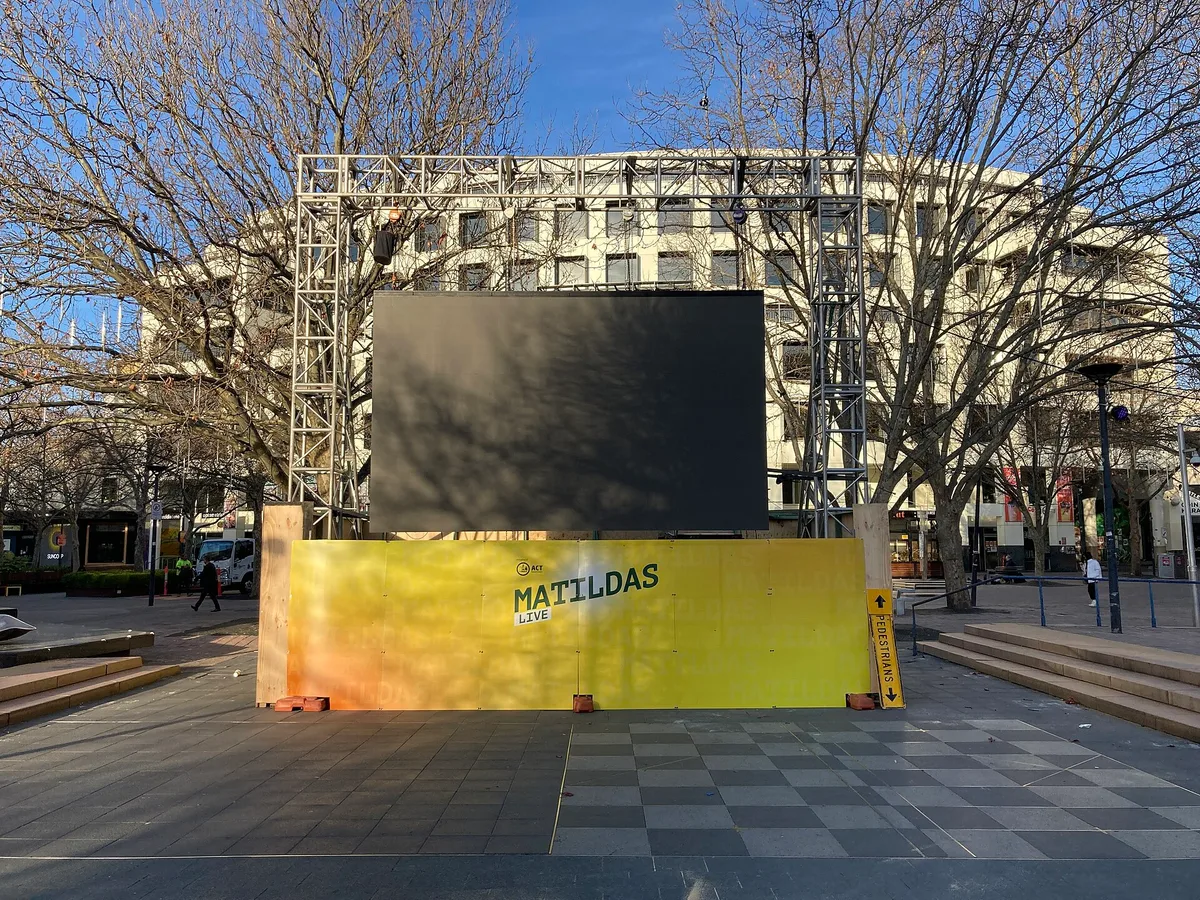
US hotel occupancy reached 67.6% in the week ended July 11, 2026, up from 63.5% the prior week, per STR/CoStar weekly data, with ADR at $166.04 and RevPAR improving week over week. The peak coincided with the busiest stretch of the FIFA World Cup, whose North American run ended July 19 — and per CoStar's reporting on the tournament window, New York City led all markets with RevPAR growth of 27.1%.
For operators, the July spike is a demand-timing lesson as much as a victory lap: an event-driven surge this concentrated rewards operators who held rate, extended minimum-stay rules, and priced event nights separately from the base calendar.
What the tournament did to the bell curve
The World Cup compressed what is normally a smooth July demand plateau into sharp event-night peaks in host metros. Occupancy in the week ended July 11 — spanning group-stage matches in several US cities — ran more than four points above the prior week, per the weekly series. Non-host markets also participated through indirect traffic and rate awareness, but the concentration is the story: New York's 27.1% RevPAR growth is an order of magnitude above the national trend line.
The read for August and the fall
Three follow-ons matter now. First, pacing: properties that captured event demand at premium rates enter August with stronger banquet and group references than last year's cohort. Second, the post-event air pocket — the days immediately after a mega-event often underperform as travelers and teams leave — so August 20-31 pacing deserves scrutiny before it becomes a discounting reflex. Third, budget-setting: with CoStar and Tourism Economics forecasting 2026 RevPAR growth of 2.8% before the tournament, a strong July puts the full-year forecast on track to be met or beaten, which raises the baseline many owners will use for 2027 underwriting.
STR/CoStar's monthly release covering July in full — the reference document for year-over-year comparisons — lands mid-August; the weekly series through the month already establishes the shape: the strongest demand weeks of the year, concentrated exactly where the tournament put them.